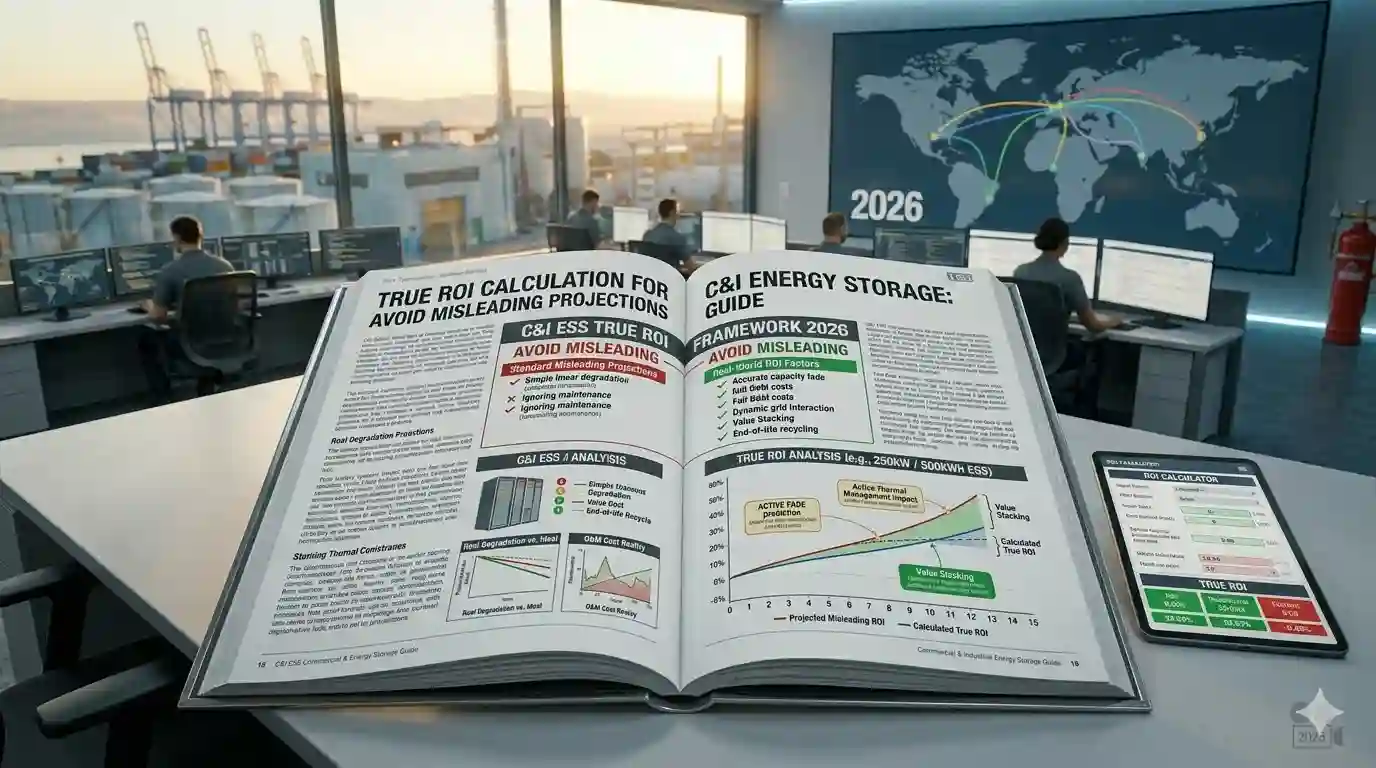
Accurately calculating the true return on investment (ROI) is the foundation of sound C&I energy storage procurement. Many suppliers provide inflated ROI projections by overstating revenues, understating costs, or ignoring critical lifecycle factors like battery degradation and maintenance. This guide breaks down the complete ROI formula, real revenue streams, hidden costs, and proven verification methods to ensure your financial projections reflect reality. For a full breakdown of all critical procurement factors, explore our comprehensive guide: The Ultimate Guide to Avoiding Pitfalls in Commercial & Industrial Energy Storage Procurement: 15 Critical Questions & Solutions (2026 Edition).
Common ROI Calculation Pitfalls
- Overstated Revenue Assumptions: Suppliers often assume 365 days of operation, maximum daily cycles, and ideal efficiency—failing to account for grid restrictions, maintenance downtime, and seasonal load variations.
- Hidden Cost Exclusions: Incomplete models omit critical expenses: annual maintenance (1–2% of CAPEX), battery replacement costs, software updates, and grid connection fees.
- Ignoring Degradation Impact: Not factoring in gradual capacity loss (2–5% annually) leads to overestimating 10+ year revenue streams.
- Simplistic Payback Period: Relying only on static payback instead of IRR, NPV, and lifecycle cash flow analysis distorts long-term profitability.
True ROI Calculation Framework (2026 Standard)
1. Complete Revenue Streams
- Peak-Valley Arbitrage: (Discharge Capacity × Efficiency × Daily Cycles × Annual Days) × (Peak Rate – Valley Rate)
- Demand Charge Reduction: (kW Reduction × Monthly Demand Rate × 12)
- Grid Ancillary Services: Frequency regulation, spinning reserve, and demand response revenues
- Local Government Subsidies: Capital grants, tax incentives, and performance rebates
2. Full Cost Deductions
- Upfront CAPEX: Equipment, installation, engineering, grid interconnection
- Annual OPEX: Maintenance, software licensing, remote monitoring, on-site service
- Lifecycle Costs: Battery replacement (8–12 years), component upgrades, end-of-life disposal
- Financial Costs: Interest, insurance, and contingency reserves
3. Core Financial Metrics
- Net Present Value (NPV): Total lifecycle cash flow discounted to present value
- Internal Rate of Return (IRR): True annualized return (industry benchmark: 8–15% for C&I)
- Payback Period: Static (simple) vs. Discounted (accurate)
- Lifecycle Profit: Total net profit over a 15–20 year system life
APEX Solution: Transparent ROI Modeling
We provide a bank-grade ROI calculator with complete transparency:
- 100% customizable parameters for local tariffs, cycles, and costs
- Built-in degradation modeling and real-world efficiency factors
- Side-by-side comparison of optimistic vs. conservative projections
- Third-party verifiable financial models for financing approval
Procurement Checklist
- Request a fully documented ROI model with all formulas and assumptions
- Validate revenue projections against local grid data and historical usage
- Ensure all costs (maintenance, replacements, insurance) are included
- Confirm calculations use discounted cash flow (NPV/IRR), not just simple payback
- For industry standards: Energy Storage ROI Calculation Standards (BATTLINK)