Battery capacity fade directly determines your C&I energy storage system’s long-term performance, revenue stability, and replacement costs. Inaccurate predictions lead to underperforming systems, lost revenue, and premature replacement expenses. This guide explains scientific degradation models, critical influencing factors, and how to validate supplier capacity guarantees. For complete procurement guidance covering all critical factors, refer to our comprehensive guide: The Ultimate Guide to Avoiding Pitfalls in Commercial & Industrial Energy Storage Procurement: 15 Critical Questions & Solutions (2026 Edition).
Common Capacity Fade Prediction Pitfalls
- Overly Optimistic Projections: Suppliers claim <2% annual fade but fail to account for real-world operating conditions.
- Ignoring Dual Degradation Modes: Not separating cycle degradation (from charging/discharging) and calendar degradation (time-based aging).
- Temperature Neglect: High operating temperatures (≥35°C) accelerate fade by 2–3x, yet this is often omitted from models.
- Vague Warranty Terms: “70% SOH after 10 years” without defining test conditions, cycles, or temperature parameters.
Scientific Capacity Fade Modeling
1. Primary Degradation Mechanisms
- Cycle Degradation: From repeated charge/discharge cycles; worsens at high DOD (>80%) and fast charging.
- Calendar Degradation: Time-based aging, accelerated by high SOC storage and elevated temperatures.
- Temperature Impact: For every 10°C above 25°C, the degradation rate approximately doubles.
- Depth of Discharge (DOD): Higher DOD (≥80%) causes significantly faster fade than moderate DOD (50–60%).
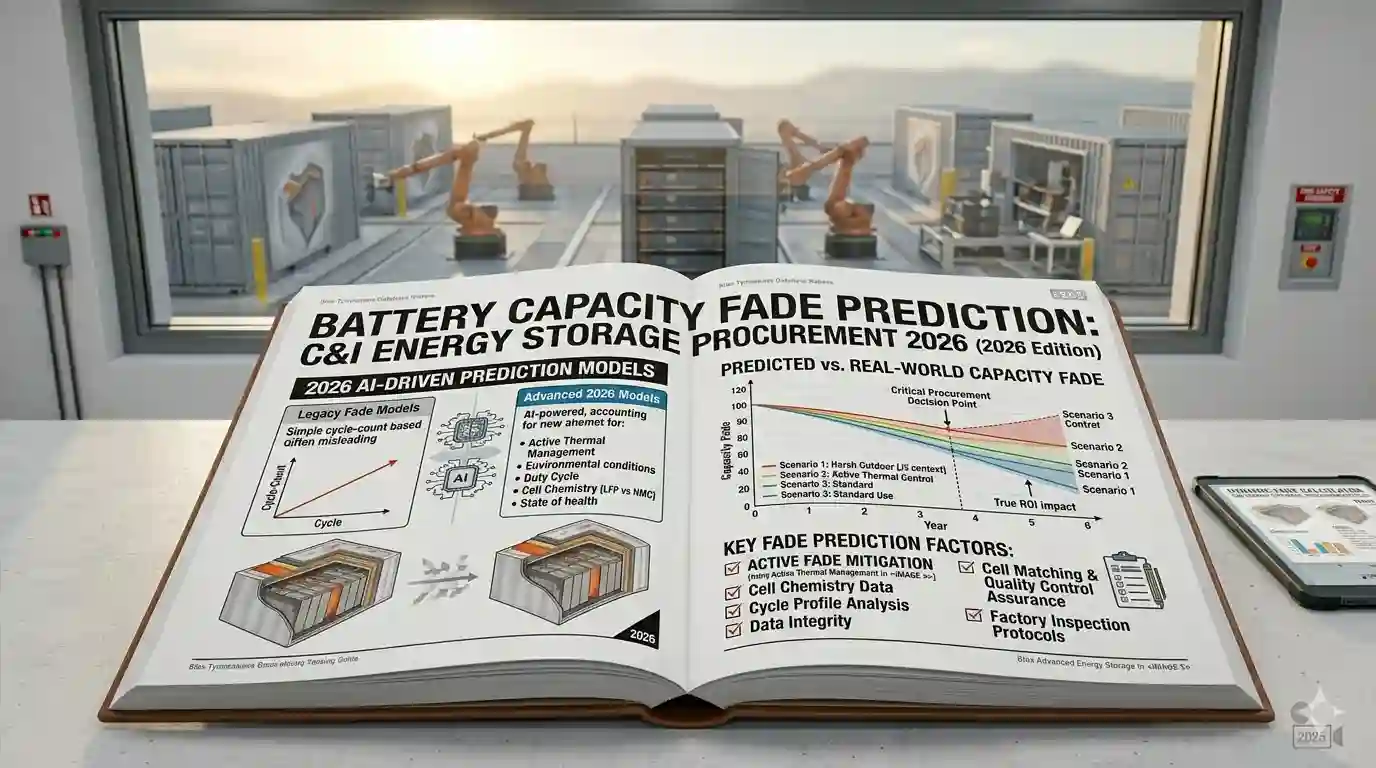
2. Industry-Standard Prediction Models
- Exponential Empirical Model: Capacity = a·e^(-b·cycle) + c (simplified, field-proven).
- AI-Powered Predictive Models: Machine learning algorithms analyzing temperature, voltage, current, and cycle data.
- Hybrid Electrochemical Models: Combine chemical kinetics with real-world operating data (highest accuracy).
3. 2026 C&I Performance Benchmarks
- LFP Batteries: 70–80% SOH retained after 6,000–8,000 cycles (10+ years @ 1 cycle/day).
- NMC Batteries: 70–80% SOH retained after 4,000–6,000 cycles (8+ years @ 1 cycle/day).
- Premium Systems: Active thermal management maintains ≤3% annual fade under standard conditions.
APEX Solution: Precision Degradation Management
- Advanced BMS with Predictive SOH: Real-time monitoring and AI-driven fade forecasting.
- Thermal Optimization: Active liquid cooling maintains an ideal 20–25°C operating temperature.
- Cycle Optimization: Smart EMS limits high-DOD cycles to extend lifespan.
- Guaranteed Fade Rates: Written warranties specifying ≤2.5% annual capacity loss (standard conditions).
Procurement Checklist
- Request third-party validated cycle life test data
- Confirm fade projections include temperature and DOD variables
- Verify warranty SOH terms define test conditions and cycles
- Ensure BMS provides real-time SOH monitoring and alerts
- For technical guidelines: IEEE Battery RUL Prediction Standards